

Service at a glance
React · PostgreSQL · Real-time · Reporting
Dashboards built around your questions
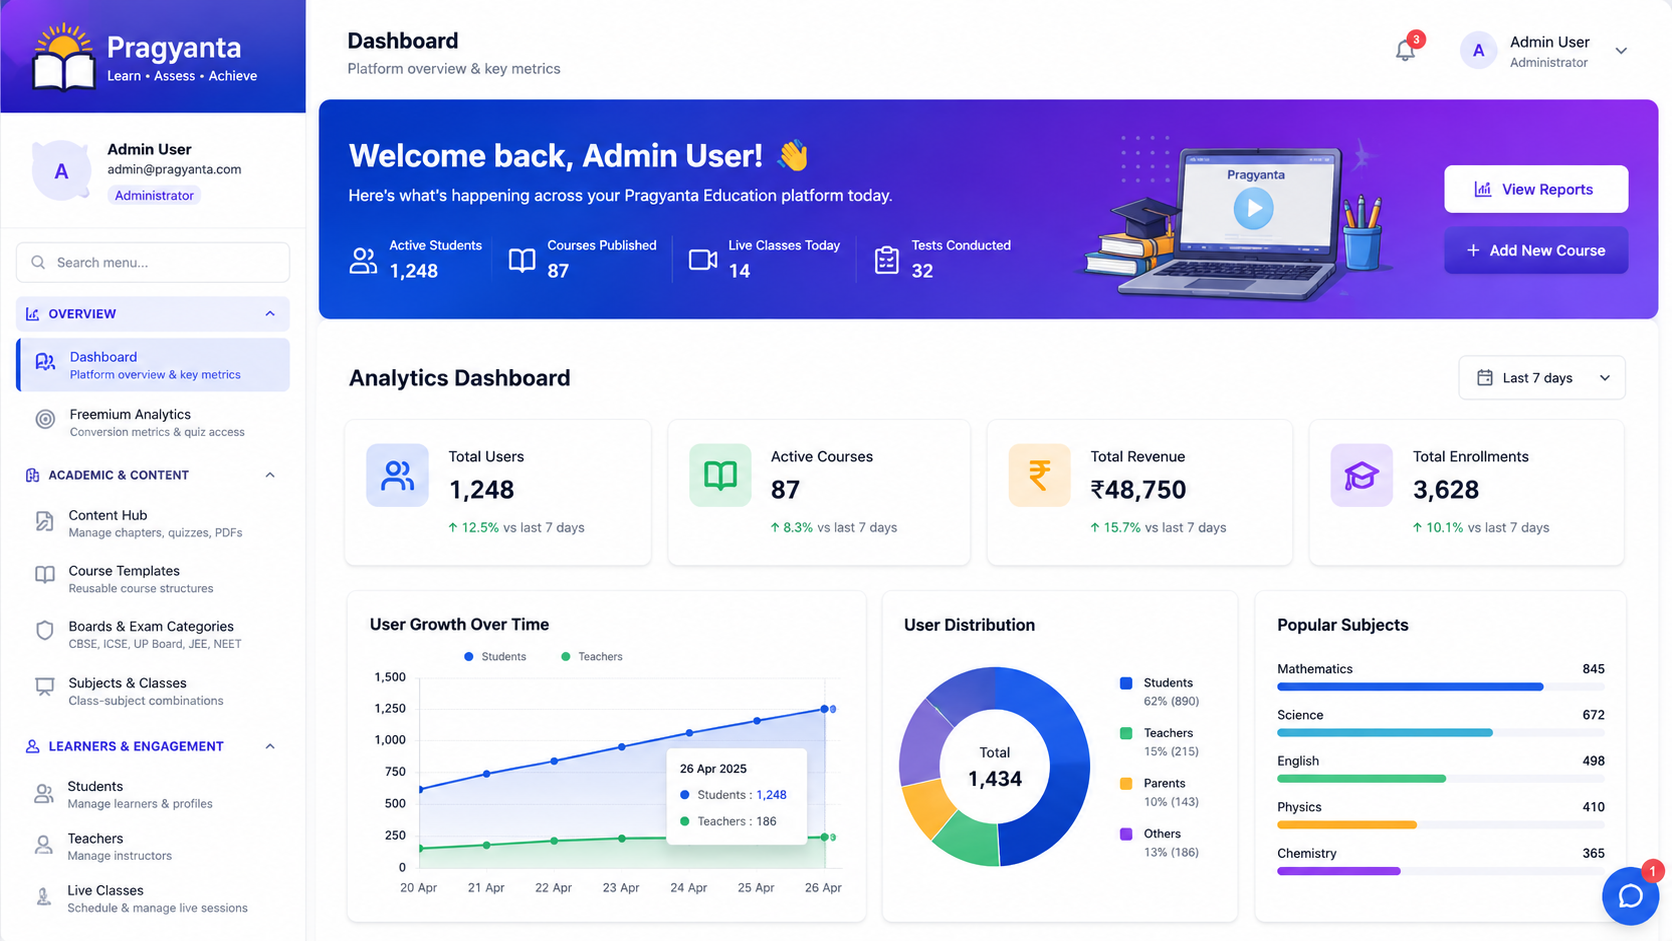
Off-the-shelf BI rarely answers the exact question you care about. We build custom dashboards — React front-ends on your data — that show the numbers your team actually needs, in real time.
What we build
- Real-time metrics, charts and drill-downs
- Role-based views for managers, teams and clients
- Reporting and export, wired to your Postgres/analytics data
- Alerts on the numbers that matter
Who it's for
Businesses drowning in spreadsheets who want one clear view of performance.
Why a generic BI tool often falls short
Off-the-shelf BI tools are built to be general — which means the specific metric your business actually cares about is usually three clicks and a custom formula away from the default view, if it is reachable at all. A dashboard built around your actual data model and the specific questions your team asks every week removes that translation step entirely, at the cost of it being built for you rather than configured by you.
How we work
The same dashboard engineering behind Pragyanta's learner and admin views — see Student Dashboards & Admin.
Questions we get asked
Can the dashboard pull from multiple data sources, not just one database?
Yes — dashboards commonly combine your core Postgres data with analytics tools, third-party APIs or exported reports, unified into one view rather than several separate tabs.
How real-time does 'real-time' actually mean?
We scope this against your actual need — true real-time (seconds) is possible but adds infrastructure complexity; for most reporting, a few minutes' latency is genuinely fine and considerably simpler to build and maintain reliably.
Can different roles see different data on the same dashboard?
Yes — role-based views are a standard part of a custom dashboard build, so a manager, a team member and an external client can each see only what is relevant to them from the same system.
Do you replace our existing BI tool or work alongside it?
Either — some clients want a full custom replacement, others want a custom dashboard for the specific metrics their existing BI tool handles badly, sitting alongside it.
How We Deliver
Discovery
We map your goals, users, workflows, integrations, and technical requirements before writing a single line of code.
Solution Design
We define architecture, user flows, data models, integrations, and delivery boundaries before build work accelerates.
Development
Sprint-based build with progress updates, code reviews, and continuous testing.
Launch & Improve
Go-live support, monitoring, operational handover, and iteration once real users begin using the system.
Related Resources
Need help shaping this service into a real delivery plan?
Connect with us to discuss scope, users, integrations, architecture, delivery risks, and the right build path for your business.
Discuss Your Project